Example code can be found on GitHub. All code on this post is licensed under MIT.
Mayhem Mandrill Recap #
The goal for this 7-part series is to build a mock chaos monkey-like service called “Mayhem Mandrill”. This is an event-driven service that consumes from a pub/sub, and initiates a mock restart of a host. We could get thousands of messages in seconds, so as we get a message, we shouldn’t block the handling of the next message we receive.
For a more simplistic starting point, we’re going to use the same starting code from Part 5. Here’s the starting point of what we’re going to profile:
import asyncio
import functools
import logging
import random
import signal
import string
import uuid

import attr


logging.basicConfig(
    level=logging.INFO,
    format="%(asctime)s,%(msecs)d %(levelname)s: %(message)s",
    datefmt="%H:%M:%S",
)


@attr.s
class PubSubMessage:
    instance_name = attr.ib()
    message_id    = attr.ib(repr=False)
    hostname      = attr.ib(repr=False, init=False)
    restarted     = attr.ib(repr=False, default=False)
    saved         = attr.ib(repr=False, default=False)
    acked         = attr.ib(repr=False, default=False)
    extended_cnt  = attr.ib(repr=False, default=0)

    def __attrs_post_init__(self):
        self.hostname = f"{self.instance_name}.example.net"


class RestartFailed(Exception):
    pass


async def publish(queue):
    choices = string.ascii_lowercase + string.digits

    while True:
        msg_id = str(uuid.uuid4())
        host_id = "".join(random.choices(choices, k=4))
        instance_name = f"cattle-{host_id}"
        msg = PubSubMessage(message_id=msg_id, instance_name=instance_name)
        logging.debug(f"Published message {msg}")
        asyncio.create_task(queue.put(msg))
        await asyncio.sleep(random.random())


async def restart_host(msg):
    await asyncio.sleep(random.random())
    if random.randrange(1, 5) == 3:
        raise RestartFailed(f"Could not restart {msg.hostname}")
    msg.restarted = True
    logging.info(f"Restarted {msg.hostname}")


async def save(msg):
    await asyncio.sleep(random.random())
    if random.randrange(1, 5) == 3:
        raise Exception(f"Could not save {msg}")
    msg.saved = True
    logging.info(f"Saved {msg} into database")


async def cleanup(msg, event):
    await event.wait()
    await asyncio.sleep(random.random())
    msg.acked = True
    logging.info(f"Done. Acked {msg}")


async def extend(msg, event):
    while not event.is_set():
        msg.extended_cnt += 1
        logging.info(f"Extended deadline by 3 seconds for {msg}")
        await asyncio.sleep(2)


def handle_results(results, msg):
    for result in results:
        if isinstance(result, RestartFailed):
            logging.error(f"Retrying for failure to restart: {msg.hostname}")
        elif isinstance(result, Exception):
            logging.error(f"Handling general error: {result}")


async def handle_message(msg):
    event = asyncio.Event()

    asyncio.create_task(extend(msg, event))
    asyncio.create_task(cleanup(msg, event))

    results = await asyncio.gather(
        save(msg), restart_host(msg), return_exceptions=True
    )
    handle_results(results, msg)
    event.set()


async def consume(queue):
    while True:
        msg = await queue.get()
        logging.info(f"Pulled {msg}")
        asyncio.create_task(handle_message(msg))


def handle_exception(loop, context):
    msg = context.get("exception", context["message"])
    logging.error(f"Caught exception: {msg}")
    logging.info("Shutting down...")
    asyncio.create_task(shutdown(loop))


async def shutdown(loop, signal=None):
    if signal:
        logging.info(f"Received exit signal {signal.name}...")
    logging.info("Closing database connections")
    logging.info("Nacking outstanding messages")
    tasks = [t for t in asyncio.all_tasks() if t is not asyncio.current_task()]

    [task.cancel() for task in tasks]

    logging.info("Cancelling outstanding tasks")
    await asyncio.gather(*tasks, return_exceptions=True)
    logging.info(f"Flushing metrics")
    loop.stop()


def main():
    loop = asyncio.get_event_loop()
    signals = (signal.SIGHUP, signal.SIGTERM, signal.SIGINT)
    for s in signals:
        loop.add_signal_handler(
            s, lambda s=s: asyncio.create_task(shutdown(loop, signal=s))
        )
    loop.set_exception_handler(handle_exception)
    queue = asyncio.Queue()

    try:
        loop.create_task(publish(queue))
        loop.create_task(consume(queue))
        loop.run_forever()
    finally:
        loop.close()
        logging.info("Successfully shutdown the Mayhem service.")


if __name__ == "__main__":
    main()
Using cProfile #
As we saw with asyncio’s debug mode, the event loop can already track coroutines that take too much CPU time to execute. But it may be hard to tell what is an anomaly, and what is a pattern.
Your first go-to may be the stdlib’s cProfile, something like this:
# using `timeout` (or `gtimeout` on macos) to send `SIGINT` signal after 5 seconds
$ timeout -s INT -k 2s 5s python -m cProfile -s tottime part-7/mayhem.py
Showing just the first 15 lines (and reminding ourselves that tottime is total time spent in seconds in a given function, excluding called sub-functions, and cumtime is total time spent in seconds in a given function, including all sub-function calls):
         60711 function calls (58785 primitive calls) in 4.877 seconds

   Ordered by: internal time

   ncalls  tottime  percall  cumtime  percall filename:lineno(function)
      189    4.781    0.025    4.781    0.025 {method 'control' of 'select.kqueue' objects}
       17    0.007    0.000    0.007    0.000 {built-in method _imp.create_dynamic}
       62    0.007    0.000    0.007    0.000 {built-in method marshal.loads}
      187    0.004    0.000    4.814    0.026 base_events.py:1679(_run_once)
  218/217    0.004    0.000    0.007    0.000 {built-in method builtins.__build_class__}
      360    0.003    0.000    0.003    0.000 {built-in method posix.stat}
       62    0.003    0.000    0.003    0.000 <frozen importlib._bootstrap_external>:914(get_data)
       42    0.002    0.000    0.002    0.000 {built-in method builtins.compile}
       59    0.002    0.000    0.002    0.000 {method 'write' of '_io.TextIOWrapper' objects}
      128    0.002    0.000    0.003    0.000 _make.py:1217(__repr__)
      195    0.001    0.000    0.007    0.000 <frozen importlib._bootstrap_external>:1356(find_spec)
       47    0.001    0.000    0.001    0.000 {built-in method posix.getcwd}
       59    0.001    0.000    0.003    0.000 __init__.py:293(__init__)
    72/15    0.001    0.000    0.003    0.000 sre_parse.py:475(_parse)
       18    0.001    0.000    0.003    0.000 enum.py:134(__new__)
You can kind of get a picture of what’s going on, but it doesn’t immediately surface any bottlenecks or particularly slow areas. That first line is essentially the event loop itself.
If we just looked at our own code:
$ timeout -s INT 5s python -m cProfile -s filename part-7/mayhem.py
         57402 function calls (55476 primitive calls) in 4.864 seconds

   Ordered by: file name

   ncalls  tottime  percall  cumtime  percall filename:lineno(function)
        8    0.000    0.000    0.000    0.000 mayhem.py:38(__attrs_post_init__)
        1    0.000    0.000    0.000    0.000 mayhem.py:42(RestartFailed)
        9    0.000    0.000    0.002    0.000 mayhem.py:46(publish)
       16    0.000    0.000    0.002    0.000 mayhem.py:59(restart_host)
       16    0.000    0.000    0.002    0.000 mayhem.py:67(save)
       23    0.000    0.000    0.002    0.000 mayhem.py:75(cleanup)
        1    0.000    0.000    0.000    0.000 mayhem.py:28(PubSubMessage)
       16    0.000    0.000    0.002    0.000 mayhem.py:82(extend)
        7    0.000    0.000    0.001    0.000 mayhem.py:89(handle_results)
       16    0.000    0.000    0.002    0.000 mayhem.py:97(handle_message)
       10    0.000    0.000    0.002    0.000 mayhem.py:110(consume)
        1    0.000    0.000    0.000    0.000 mayhem.py:129(<listcomp>)
        1    0.000    0.000    0.000    0.000 mayhem.py:131(<listcomp>)
        2    0.000    0.000    0.000    0.000 mayhem.py:144(<lambda>)
        3    0.000    0.000    0.001    0.000 mayhem.py:124(shutdown)
        1    0.000    0.000    4.803    4.803 mayhem.py:139(main)
        1    0.000    0.000    4.864    4.864 mayhem.py:8(<module>)
We still don’t immediately surface any bottlenecks or particularly slow areas.
Of course our main function would have the most time cumulatively since that is where the event loop is ran. But nothing is immediately obvious.
Using cProfile with (K|Q)CacheGrind #
Let’s try this again but with the help of pyprof2calltree and kcachegrind (for those with macOS, just brew install qcachegrind).
First, we save the cProfile output:
$ timeout -s INT 5s python -m cProfile -o mayhem.cprof mayhem.py
Then we use pyprof2calltree to take the output of cProfile and convert the data into something that kcachegrind can understand.
$ pyprof2calltree -k -i mayhem.cprof
And you see something like this:
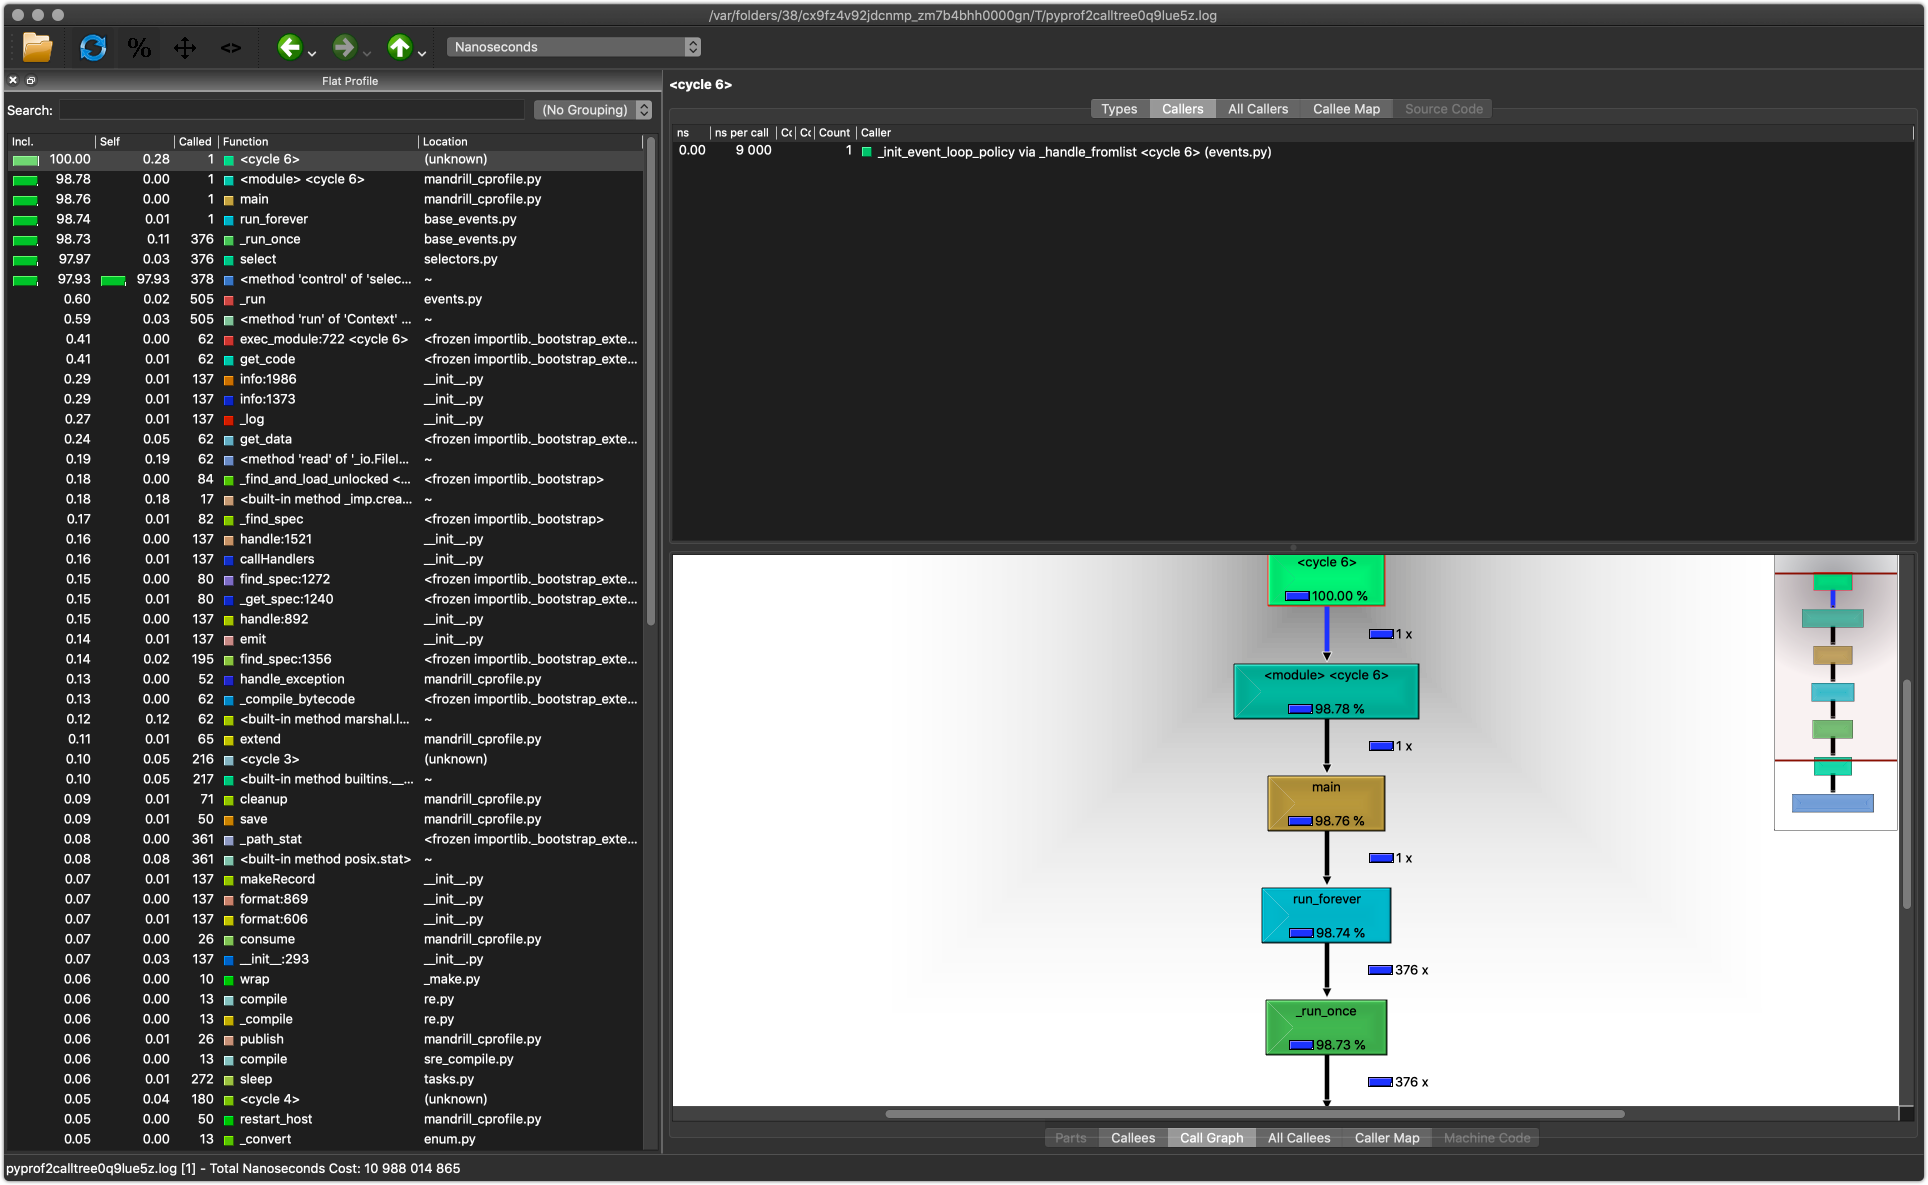
When that script is ran, you are met with this UI.
It’s okay if you can’t make anything out. But basically, on the lefthand side,there’s the profiling data that we would otherwise see as the output from cProfile.
The two sections in the right shows information about callers and callees, including a call graph, on the bottom, and a map of callees (on the top).
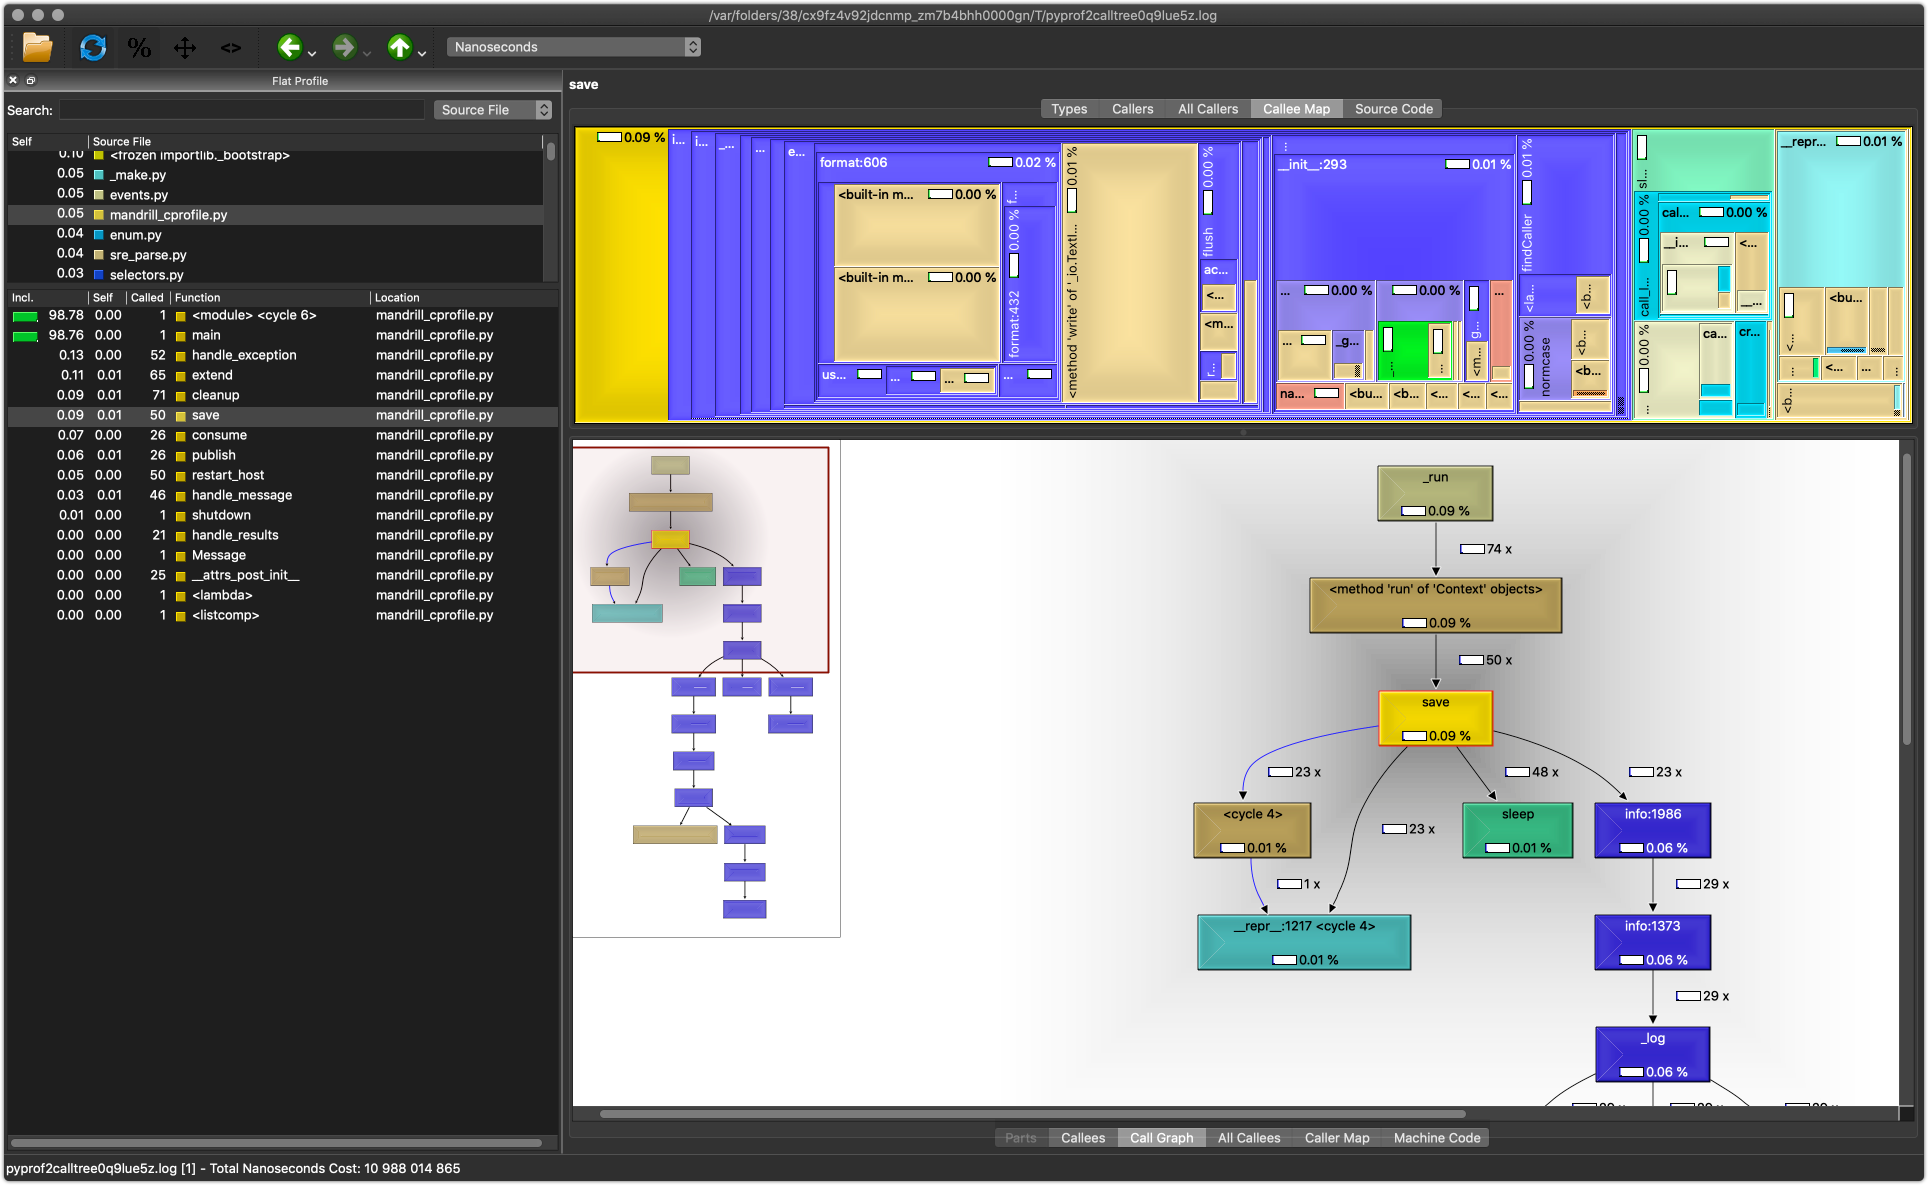
_run of the event loop (click for full view)
KCacheGrind will group modules together by color. So in looking at that second image, the callee map that’s on the top-right, we see a lot of blue. When clicking on the blue, we see that it’s the color for the logging module.
Hmm, interesting… let’s hold onto that thought.
Profiling with line_profiler
#
KCacheGrind allowed us to get a broad picture of what was going on, and gave us visual cues of where to look for potential areas of unnecessary time spent. With the line_profiler package, we can get hone in on areas of our code of which we’re suspicious.
line_profiler is a handy little tool that allows you to profile lines directly, which is quite nice compared to the above cProfile outputs. This way, we’ll see exactly what we want.
To get started, we must add the @profile decorator to every function that we care about (I just decorated everything). Note that we do not import anything. This is because line_profiler’s command, kernprof does some magic to inject itself into the builtins.
@profile
async def save(msg):
    # unhelpful simulation of i/o work
    await asyncio.sleep(random.random())
    msg.saved = True
    logging.info(f"Saved {msg} into database")
Once we’ve decorated all functions we’re interested in, we’ll run the kernprof command like so:
# filetype of output can be anything; `lprof` doesn't mean anything in particular
$ timeout -s INT 10s kernprof -o mayhem.lprof -l mayhem.py
After 10 seconds, we should have a mayhem.py.lprof file, for which we can use line_profiler to print stats to stdout:
$ python -m line_profiler mayhem.py.lprof
And we see stat groupings for each decorated function. To highlight, here’s the main function:
Timer unit: 1e-06 s

Total time: 0.002202 s
File: mayhem.py
Function: save at line 69

Line #   Hits     Time  Per Hit   % Time  Line Contents
=======================================================
    69                                    @profile
    70                                    async def save(msg):
    71      8    259.0     32.4     11.8      await asyncio.sleep(random.random())
    72      8     26.0      3.2      1.2      msg.saved = True
    73      8   1917.0    239.6     87.1      logging.info(f"Saved {msg} into database")
In the beginning of the output, line_profiler tells us that the time is in microseconds (1e-06s), and that we’ve spent just over 2 milliseconds in our save coroutine function. It also shows us the majority of that time was spent on the logging.info line.
If only there were something we could do about it…
Interlude: aiologger
#
Coincidentally, someone has done something about it. There’s a package called aiologger that allows for non-blocking logging.
So if we switch out our default logger with aiologger:
import aiologger

logger = aiologger.Logger.with_default_handlers()

# <--snip-->
await logger.info(...)
Then rerun line_profiler:
$ timeout -s INT 5s kernprof -o mayhem.lprof --line-by-line mayhem.py
$ python -m line_profiler mayhem.lprof

Timer unit: 1e-06 s

Total time: 0.0011 s
File: mayhem.py
Function: save at line 69

Line #   Hits     Time  Per Hit   % Time  Line Contents
=======================================================
    69                                    @profile
    70                                    async def save(msg):
    71      7    269.0     38.4     24.5      await asyncio.sleep(random.random())
    72      5     23.0      4.6      2.1      msg.saved = True
    73      5    808.0    161.6     73.5      await logger.info(f"Saved {msg} into database")
We see that our total time spent in the function has halved, as well as the time spent while logging.
Certainly, these are miniscule improvements that we’re doing here. But imagine this at a larger scale, with everywhere we’re logging. And as I see it, if we have an event loop, let’s try and take full advantage of it!
Live Profiling #
We’ve profiled using cProfile and line_profiler, but we need to stop the service in order to look at results. Perhaps you’d like a live profiler to go along with your production testing and debugging!
There’s a package called [profiling] that provides an interactive UI, and supports asyncio as well as threads and greenlets. Granted, you can’t attach to a currently-running process as is; you’ll need to launch your service with it in order to do so:
$ profiling live-profile --mono mayhem.py
Running profiling gives you a text-based UI that regularly updates (similar to top). You can drill down, and pause it while inspecting something, and restart it.

profiling tool (click for full view)
You’re also able to save the performance data to view it in the UI at another time, similar to how you’d handle cProfile‘ing output.
Finally, it provides a server allowing you to remotely connect to it. On your server, start the service via:
# limit it to localhost:
$ profiling remote-profile webserver.py --bind 127.0.0.1:8912
# or make it accessible from the outside (make sure this is secure if you do it this way!)
$ profiling remote-profile webserver.py --bind 0.0.0.0:8912
Then create a client:
$ profiling view 127.0.0.1:8912
# or remotely
$ profiling view my-host.example.net:8912
Recap #
There isn’t much difference with profiling asyncio code from non-asyncio. It can be a little confusing just looking at cProfile output though. So to get an initial picture of your service’s performance, using cProfile with KCacheGrind and pyprof2calltree can help surface areas to investigate. Without that visualization, we saw that it can get a bit difficult to see hotspots.
Once you have an idea of hotspot areas, you can use line_profiler to get line-by-line performance data.
If you want to profile with production data, I suggest taking a look at the profiling package.
And finally, I suggest using aiologger to unblock your event loop.